A scoring average tells you what a player did. It doesn't tell you what he changed. This page explains the tools we use to go further, how we calculate them, and above all how far we can trust them.
Five principles
Impact before production. What matters is what the team becomes when a player is on the floor, not just what he puts in the box score.
Context first. A number without its teammates, opponents and role doesn't mean much.
Sample before conclusion. Three games is a lead. A season is a clue. Several seasons is proof.
Always a range. When we project, we say how wrong we might be.
Everything can be checked. Sources at the bottom of every feature, calculations explained here, mistakes corrected in public.
How many minutes before you believe it?
This is the most important lesson on this page. The on-court differential is the most telling tool in basketball, and the most misleading on small samples. Drag the slider: the red zone is everything a measured differential of zero could be hiding.
Margin of error on a point differential, per 100 possessions±41 pointsafter 28 minutes on the floor
A simplified model, for teaching purposes: it ignores teammates and opponents, which add even more uncertainty. Assumptions: about 2.1 possessions per minute and a spread of about 1.6 points per pair of possessions.
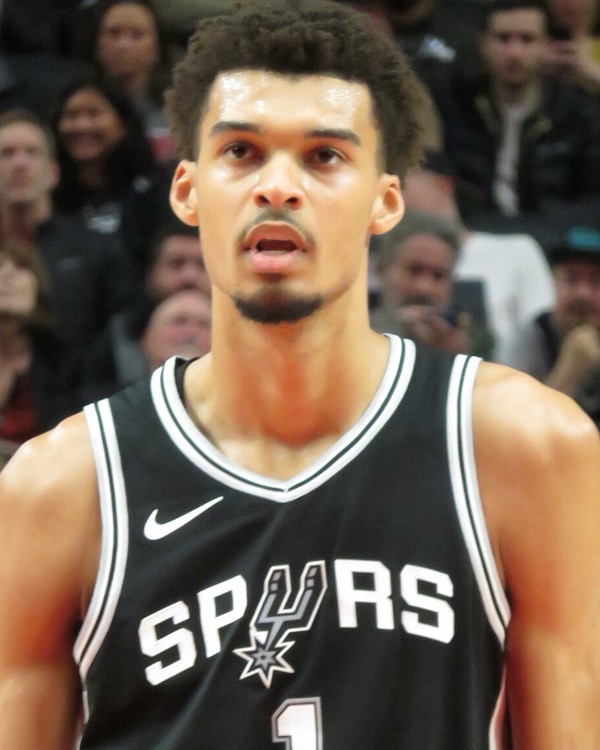
In practice: the Spurs' three-guard lineup at +2, measured over 28 minutes, is consistent with an excellent group and with a disastrous one. On the other hand, the gap between the minutes with and without Wembanyama, about 48 points per 100 possessions, is larger than the margin of error for that comparison (about ±38), even over three games. Barely: it's a signal, to be confirmed. The lineup's +2 is noise.
What happened next proved the point. 13 games later, the three-guard lineup is at +86 in 113 minutes: its early +2 meant nothing. The with-and-without gap for Wembanyama held up (+250 with him, −78 without).
Example: what three games can tell you
Spurs with Wembanyamasignal, to be confirmed · 95 min+32
Spurs without Wembanyamasignal, to be confirmed · 49 min−32
The three-guard lineupnoise · 28 min+2
Glossary
TS%
True Shooting
What it measures
A scorer's efficiency, in a single number.
How we calculate it
Points ÷ (2 × (field goal attempts + 0.44 × free throw attempts)). The 0.44 accounts for free throws that come in twos or threes.
The limit
Says nothing about shot difficulty or who created the shot. 60% on spoon-fed dunks isn't worth the same as 60% in isolation.
The point difference between a team and its opponent while a player, or a group, is on the floor. On/off compares the minutes he plays with the minutes he sits.
How we calculate it
Points scored minus points allowed, minute by minute. Sometimes scaled to 100 possessions to compare different playing times.
The limit
Very noisy on small samples (see above), and dependent on teammates: an average backup who always plays with the best player will post a nice number.
Who would deserve the MVP award today, if we took the voters' criteria seriously: production, winning, impact, efficiency and availability.
How we calculate it
Each criterion is graded from 0 (the worst of the players logging at least 26 minutes a game) to 100 (the best), except availability, graded on the 17 games a player can miss before the 65-game rule kicks in. The OBX is the weighted average of the five grades (35, 25, 20, 10 and 10%). Recalculated every day by the maj:mvp script.
The limit
It doesn't see defense beyond blocks and steals, nor the narrative, nor voter fatigue. It tells you who deserves it, not who will win.
What each five-man group produces, and every combination (the three guards together, Fox without Wembanyama…).
How we calculate it
We start from each game's starters, then apply every substitution in ESPN's play-by-play. We check the result: each player's rebuilt differential has to match his official plus/minus. We publish the margin: within 4 points over the Spurs' 13 games, 5 over the Sixers' 13. The script is called maj:cinqs.
The limit
Substitutions between quarters aren't always logged, hence small gaps. And a lineup that played 10 minutes proves nothing on its own.
The on-court differential, adjusted for the quality of teammates and opponents. It is the basis of almost every modern impact metric.
How we calculate it
A statistical regression over every combination of players across one or more seasons. We don't compute it ourselves: it takes thousands of possessions to stabilise.
The limit
Slow to converge, and unstable over a single season. The metrics below exist precisely to give a faster estimate.
Impact metrics
BPM, CraftedPM, DARKO
What it measures
An estimate, in points per 100 possessions, of what a player adds compared with an average player.
How we calculate it
BPM (Daniel Myers) starts from the box score. CraftedPM (CraftedNBA) adds tracking data. DARKO (Kostya Medvedovsky) is predictive: it weighs the player's whole history.
The limit
They never agree with each other, and that is information in itself: a jump in BPM with a flat DARKO means "great season, to be confirmed".
Three metrics created by Ben Taylor (Thinking Basketball): how much the offense runs through a player, how many open shots he creates for others, and how well his game holds up next to other very good players.
How we calculate it
Estimated from the box score and tracking data. Our numbers come from CraftedNBA.
The limit
These are estimates, not counts. They describe a role better than they measure value.
Our estimate of how much each young player will matter in one, five and ten years.
How we calculate it
Four editorial grades (production, growth, profile, context), weighted differently for each horizon, plus a range that widens with time and risk. The calculation is automatic: we choose the grades, not the result.
The limit
The grades are opinions. All of them are published, so each one can be challenged.
Box scores and play-by-play: ESPN. That's where our averages, differentials and lineups come from. It is a public but unofficial source: for commercial use, we will switch to a licensed data provider.
Awards, votes, season stats: NBA.com, Basketball-Reference, Land of Basketball.
Advanced metrics: CraftedNBA (BPM, CraftedPM, DARKO, Ben Taylor's metrics).
Rosters and moves: NBA.com, Wikipedia, Hoops Rumors, ESPN, and BleuBlancDunk for the French players.
Jersey sales: official NBA / NBPA rankings.
We cross-check whenever we can. When a number rests on a single source, the feature says so.
And when we're wrong?
We correct it, flag it in the feature, and keep a record of what changed. Our projections are meant to be brought back up: see you in April for the rookies, and in ten years for the rest. We may be wrong. At least it will be measurable.